CASE FILE 001 · EDUCATION / AP EXAM PREP · OPENED DEC 2024 · STATUS: ACTIVE
How a Full-Time Vice Principal Added $648,022 to His Side Hustle
With a done-for-you Full-Stack GTM Install — built and operated around his W2 day job. He didn’t quit. He didn’t record his own ads. He didn’t hack an algorithm. The system did the work.
$648,022
REVENUE CLOSED · CALENDAR 2025 [1]
$612,072
2026 REVENUE BY JULY 18 · 94% OF 2025 IN 6.5 MONTHS [1]
THE FILE, NARRATED — WATCH BEFORE READING IF YOU PREFER
THE SITUATION
Dr. Joe Sebestyen III, Ed.D. is a full-time vice principal and a College Board Certified AP instructor. School all day. Dinner at five. Sales calls from 6 to 9pm. That’s the schedule his business had to fit inside.
SupportED Tutoring was already good at the thing that matters — getting students 4s and 5s on AP exams and saving their families serious tuition money. What it didn’t have was a go-to-market system. Revenue averaged $16,097/month in cash (2023), driven by word of mouth, referrals, and one Facebook Group.
Then, December 2024: Facebook suspended his account overnight— and the Group went with it. His only funnel. His only lead source. Gone. He called us and said “what do we do now?”
The crisis forced the right decision: stop renting your distribution. Own the full stack.
THE INTERVENTION
The Full-Stack GTM Install: a Spear and a Net.
Everything we installed falls into two halves. The Spear earns attention and generates pipeline. The Net catches that pipeline and converts it into cash. Most businesses have half of one. You need both.
The Spear — argument-first demand capture
Before a single ad ran, we built the argument: the beliefs parents actually hold, the chain they care about (pass AP → college credit → tuition saved → “I didn’t fail my kid”), mapped across awareness levels. Then a creative matrix deployed it at volume — 1 winning argument × hooks × openers × messengers = 30–240 testable ads, produced without the founder recording anything. Our top performer wasn’t the founder at all: “Sarah,” an AI-assisted fellow-parent messenger speaking from her car, at a $18.92 CPL — 20.4% cheaper than the authority angle.
The Net — invisible growth infrastructure
Application funnel and quiz pipeline with diagnostic scoring. Automated warm-up sequences that cut no-shows. Trust-building content so prospects arrive at the call already 70% sold. No-show re-engagement. Sales VAs running pipeline admin. An AI sales co-pilot reviewing every call. And a pitch refined over hundreds of live conversations — calibrated for parents who buy on security, not status.
A note on the tools: creative production leaned on AI-assisted messengers and programmatic editing — a production convenience that removed the founder bottleneck, not the mechanism itself. The ads convert because of the argument underneath. In 2026 we’re producing human-recorded creative with AI handling post-production. The tools rotate. The engine stays.
THE ENGAGEMENT, WEEK BY WEEK
DEC 2024
Facebook account suspended; Group gone. Application funnel rebuilt from scratch on owned infrastructure.
JAN–MAY 2025
Peak AP season. Creative matrix + broad targeting drives CPLs to $5.33–$23.82 across core campaigns.
JUN–AUG 2025
The perfect storm: outsourced media buyer underperforms, ad costs spike, new sales reps miss. Summer demand craters.
SEP–OCT 2025
Campaigns brought back in-house. In-house media buyer trained. Underperforming reps cut. Unit economics stabilized.
JAN 2026
First $100K+ month: $121,586 — while onboarding brand-new sales reps.
JUL 2026
2025's full-year revenue nearly matched in 6.5 months. Operators placed to run day-to-day; founder-side motion productizing.
THE NUMBERS
$1.8M
QUALIFIED PIPELINE, 2025
2,272
LEADS GENERATED, 2025
36%
PIPELINE → REVENUE CONVERSION
8.63x
BLENDED ROAS, 2025 [2]
$75,113.89
TOTAL AD SPEND, 2025
$605,752
CASH COLLECTED, 2025
122%
REVENUE GROWTH YOY, 2024→2025
0 hrs
FOUNDER TIME RECORDING ADS, 2025
EXHIBIT B — CLIENT SLACK, 2025 ROAS BY MONTH
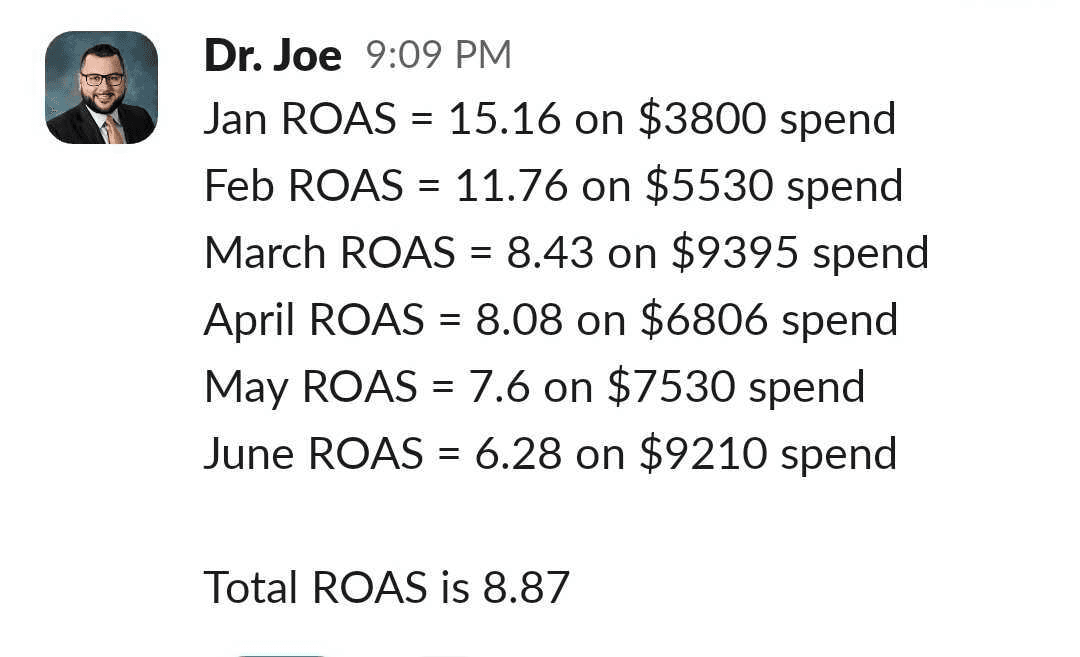
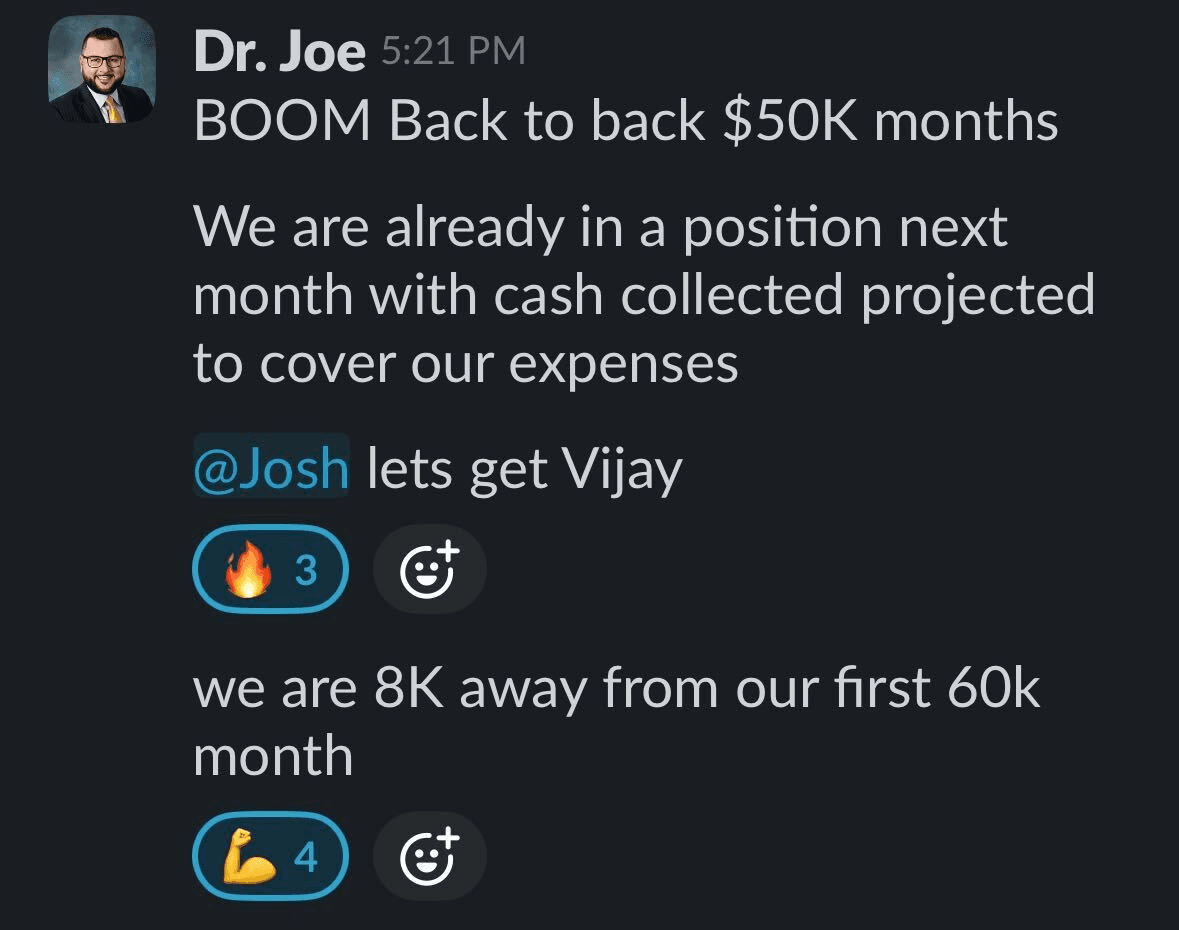
EXHIBIT C — CLIENT SLACK
REVENUE BY MONTH — 2025 VS 2026, FROM THE SHARED KPI TRACKER [1]
| MONTH | 2025 | 2026 |
|---|---|---|
| JAN | $57,620 | $121,586 |
| FEB | $65,050 | $92,754 |
| MAR | $79,210 | $164,030 |
| APR | $54,992 | $86,508 |
| MAY | $60,200 | $32,800 |
| JUN | $57,900 | $65,997 |
| JUL | $36,635 | $46,797 |
| AUG | $42,771 | — |
| SEP | $44,105 | $1,600* |
| OCT | $35,547 | — |
| NOV | $42,051 | — |
| DEC | $71,941 | — |
| TOTAL | $648,022 | $612,072 thru JUL 18 |
*Contract closed by Jul 18, revenue dated to September in the tracker — included in the total. Read the shape honestly: AP season peaks Jan–May, summer dips hard — 2025’s summer included a vendor failure and a sales-team miss we’ve documented above. 2026 cash collected through July 18 ($644,952) has already passed 2025’s full year ($605,752).
“We've had the two best months I've ever had in the business. I've never been more confident as a business owner.”
WHAT CHANGED — AND WHERE IT STANDS, JULY 2026
The trajectory, in the client’s own tracking:
2024 · $22,580/mo avg — first ads, $34,799 total spend
2025 · $50,092/mo avg — engine installed · $648,022 closed · 8.63x ROAS
2026 · $121,586 January · 94% of 2025’s revenue by July 18
Through June 2026 I was in the trenches directly — media buying, creative, funnel, sales ops. Since then the engagement has shifted on purpose: we placed and trained operators to run the day-to-day, and my role is moving to product and consulting. That’s not a wind-down — it’s the point. A full-stack install you own shouldn’t need its architect in the room every day.
The next build is already in testing: leaning the sales-led motion out into a simpler product-led one. Lower the cost of the first conversion with entry offers. Let the pipeline self-qualify before a rep ever picks up the phone. Scale past the book-a-call ceiling so revenue stops being capped by calendar slots.
Most experts don’t have an offer problem. They have a go-to-market problem. This is what fixing it looks like — storms included.
IN THE CLIENT’S WORDS
Dr. Joe Sebestyen — SupportED Tutoring
Two best months ever
INSIDE THE NET — SALES VA, ON THE PIPELINE ADMIN LAYER
VERIFICATION
- [1] Revenue, cash and ad spend from the shared client KPI tracker (Google Sheets), maintained jointly with the client and verified July 18, 2026. Revenue = closed contracts; cash = collected in period. 2026 figures are year-to-date through July 18: revenue $612,071.84, cash $644,952.40, spend $70,189.51.
- [2] ROAS = revenue ÷ ad spend for the same window. 2025 blended: $648,022 ÷ $75,113.89 = 8.63x. Monthly ROAS peaked at 15.16x (January 2025, Exhibit B). January 2026: $121,586 on $8,614 spend ≈ 14x.
- [3] Pipeline ($1.8M qualified) and lead counts (2,272) from Meta Ads Manager + CRM application records, 2025. Almost 100% cold traffic.
- [4] Slack exhibits are reproduced as sent. What went wrong is included on purpose: summer 2025 saw a vendor failure, rising ad costs, and sales-rep misses before the fall rebound — see the timeline.
- [5] Results reflect this client's offer, market, and execution. They are a record, not a promise.
Open a file on your funnel.
Every engagement starts the same way this one did: a diagnostic of what’s broken in your go-to-market — before anything gets built.